Simulating a simple NMOS test transistor
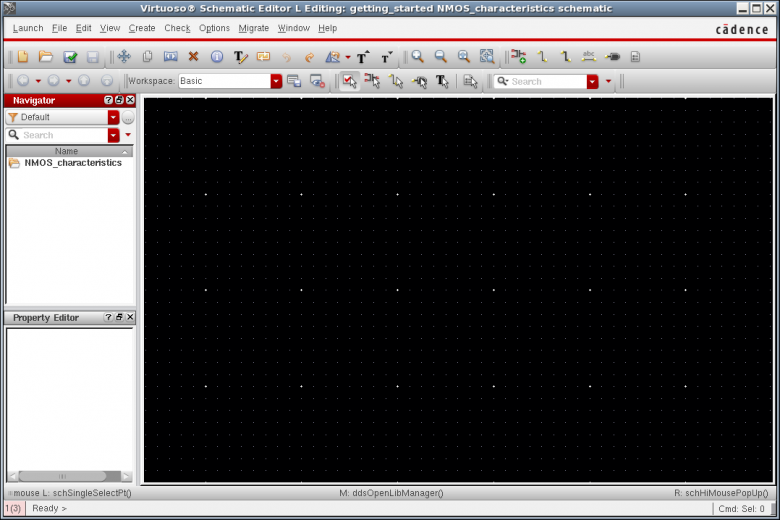
LM ⇒ File ⇒ New ⇒ Cell View…
License check:
A higher checked out license allows you to run lower tier applications. For example, you can run L and XL in the same session with only an XL license checked out.
Schematic entry
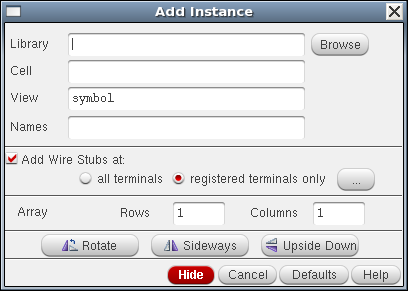
Schematic L ⇒ Create ⇒ Instance
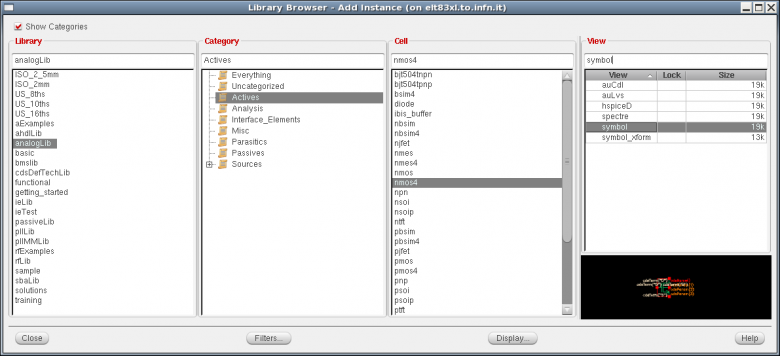
Add Instance window ⇒ Browse
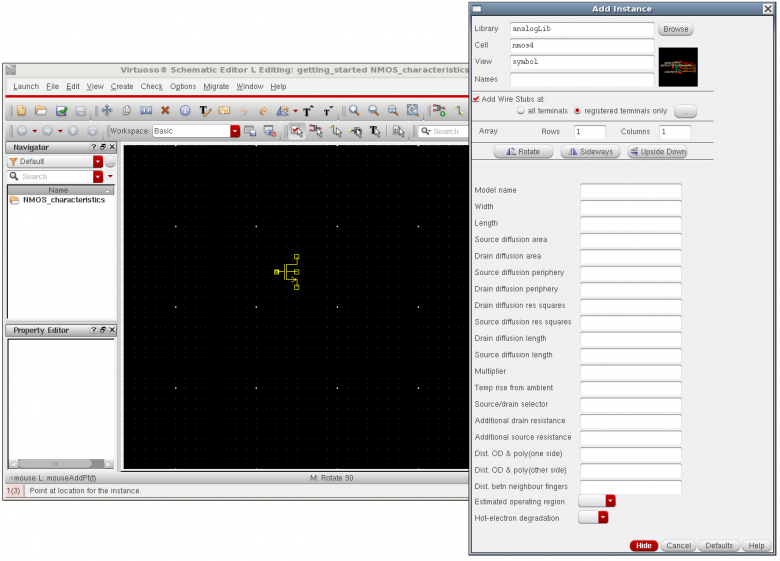
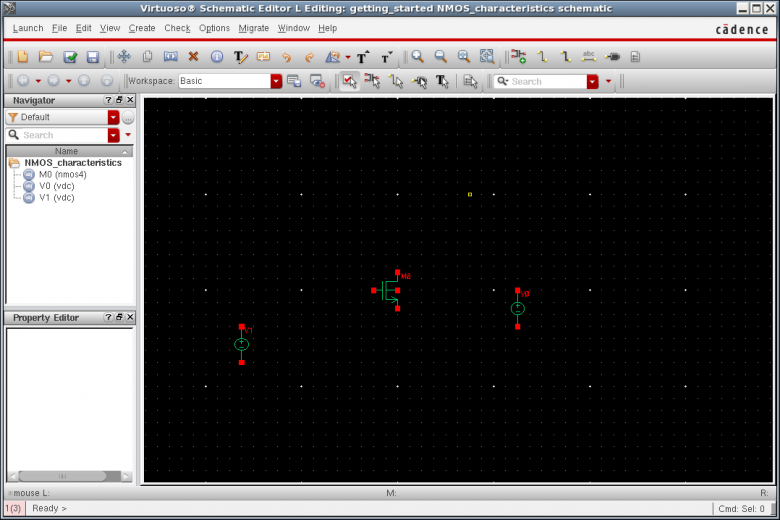
analogLib ⇒ Actives ⇒ nmos4
ESC per concludere l'istanziazione
Ctrl + d per deselezionare un instance
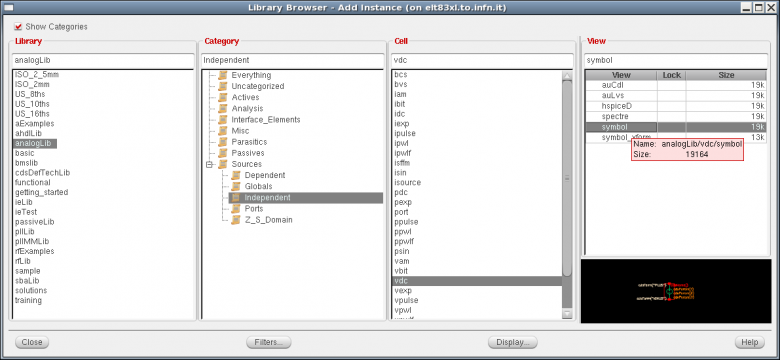
analogLib ⇒ Sources ⇒ Independent ⇒ vdc
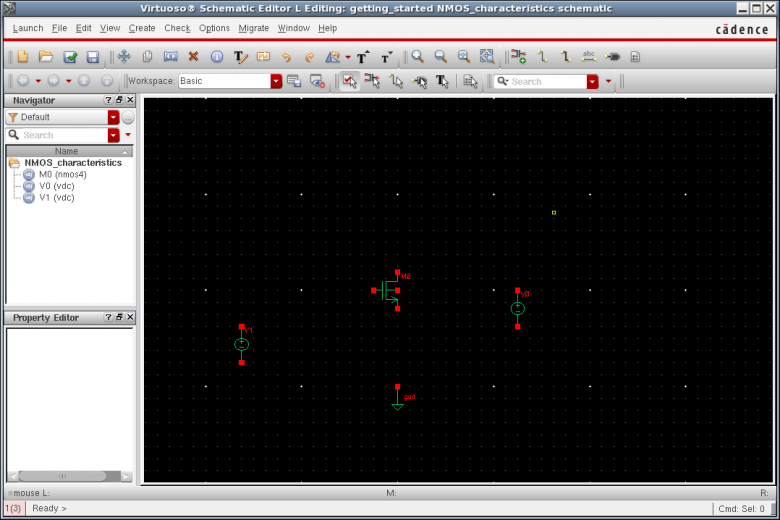
analogLib ⇒ Sources ⇒ Independent ⇒ gnd
Notare come nel Navigator pane e' comparso uno storico di cio' che e' stato istanziato
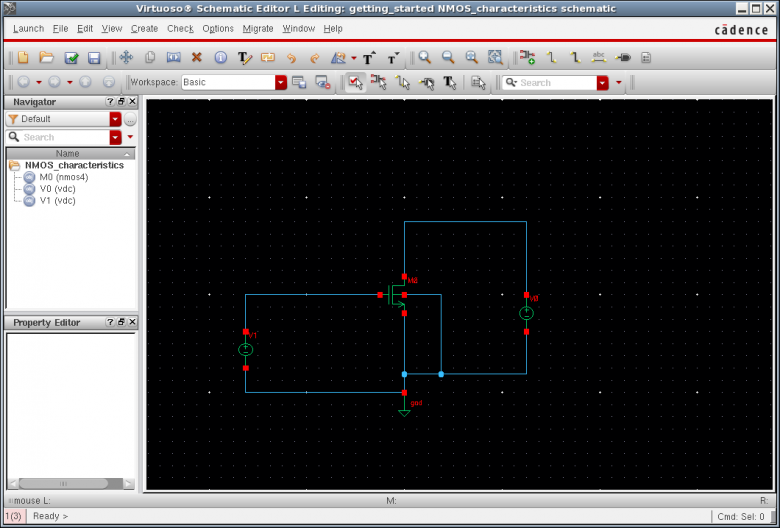
Schematic L ⇒ Create ⇒ Wire (narrow)
Schematic L ⇒ File ⇒ Check and Save
Schematic L ⇒ Create ⇒ Note ⇒ Text…/Shape…
Schematic L ⇒ Create ⇒ Wire Name…
Check and Save e controllare no errors
Notare come se labello anche il source che in realta' e' il gnd il check and save mi da' errore!
Errors exist, ok to continue to save? ⇒ No
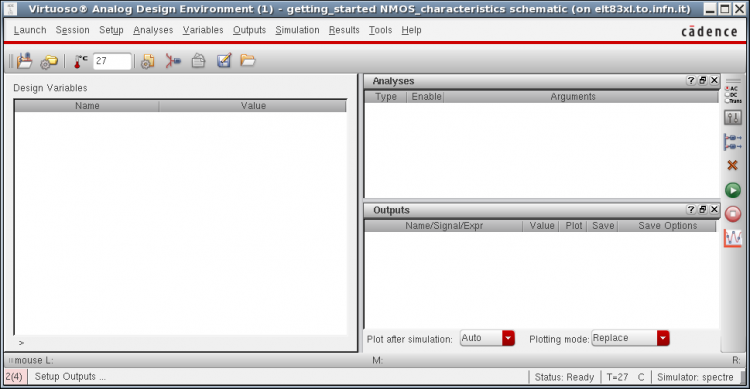
The ADE GUI
Il concetto da non dimenticare e' che come ogni altra GUI, ADE e' solo un'interfaccia per generare il codice Spectre in modo piu' user-friendly che poi il simulatore mangia
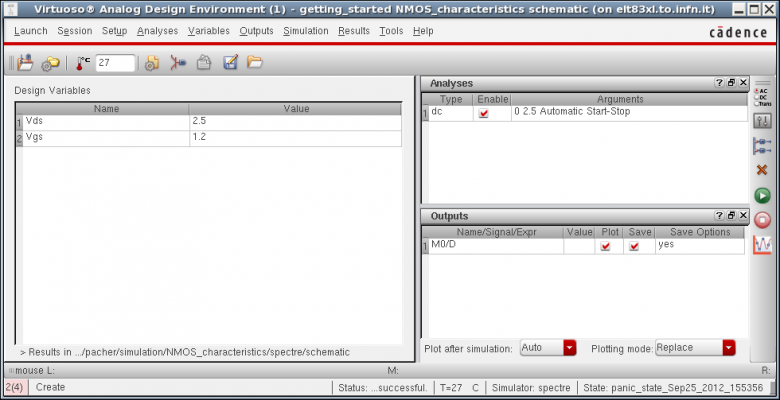
Schematic L ⇒ Launch ⇒ ADE L
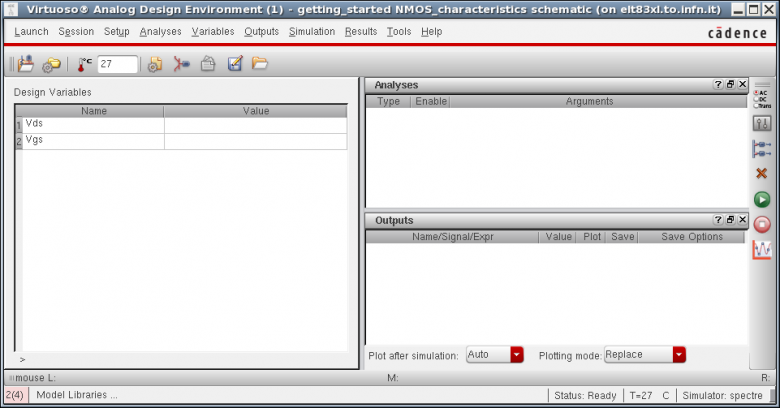
ADE L ⇒ Variables ⇒ Copy From Cellview
Set Vds = 2.5 and Vgs = 1.2, NO UNITS !!!!
SPICE modeling
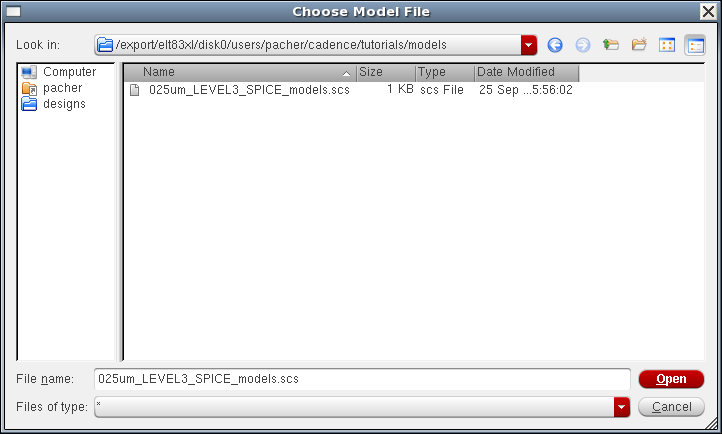
cd ~/cadence/tutorials/models
mkdir spice
cd spice
gedit 250nm_LEVEL3_SPICE_models.scs &
oppure usare l'editor preferito:
simulator lang=spice

// examples of 0.25 um SPICE models

.MODEL nfet NMOS (                                  LEVEL  = 3
+ TOX    = 5.7E-9          NSUB   = 1E17            GAMMA  = 0.4317311
+ PHI    = 0.7             VTO    = 0.4238252       DELTA  = 0
+ UO     = 425.6466519     ETA    = 0               THETA  = 0.1754054
+ KP     = 2.501048E-4     VMAX   = 8.287851E4      KAPPA  = 0.1686779
+ RSH    = 4.062439E-3     NFS    = 1E12            TPG    = 1
+ XJ     = 3E-7            LD     = 3.162278E-11    WD     = 1.232881E-8
+ CGDO   = 6.2E-10         CGSO   = 6.2E-10         CGBO   = 1E-10
+ CJ     = 1.81211E-3      PB     = 0.5             MJ     = 0.3282553
+ CJSW   = 5.341337E-10    MJSW   = 0.5             )


.MODEL pfet PMOS (                                  LEVEL  = 3
+ TOX    = 5.7E-9          NSUB   = 1E17            GAMMA  = 0.6348369
+ PHI    = 0.7             VTO    = -0.5536085      DELTA  = 0
+ UO     = 250             ETA    = 0               THETA  = 0.1573195
+ KP     = 5.194153E-5     VMAX   = 2.295325E5      KAPPA  = 0.7448494
+ RSH    = 30.0776952      NFS    = 1E12            TPG    = -1
+ XJ     = 2E-7            LD     = 9.968346E-13    WD     = 5.475113E-9
+ CGDO   = 6.66E-10        CGSO   = 6.66E-10        CGBO   = 1E-10
+ CJ     = 1.893569E-3     PB     = 0.9906013       MJ     = 0.4664287
+ CJSW   = 3.625544E-10    MJSW   = 0.5             )
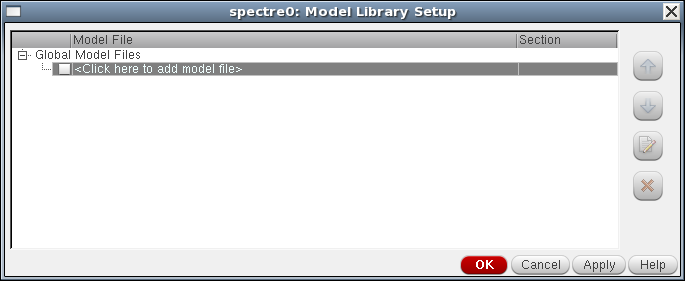
ADE L ⇒ Setup ⇒ Model Libraries
Further reading about how to use SPICE models in Spectre can be found here
Ulteriori SPICE models can be found here through the Mosis service oppure sono dati dalla cadence stessa:
/usr/cadence/tools/dfII/samples/artist/models/spectre
Conviene farsi un link simbolico:
cd ~/cadence/tutorials/models
ln -s /usr/cadence/tools/dfII/samples/artist/models/spectre CDS.models
Working with input design variables and expressions
Data l'importanza tanto vale metterlo subito!
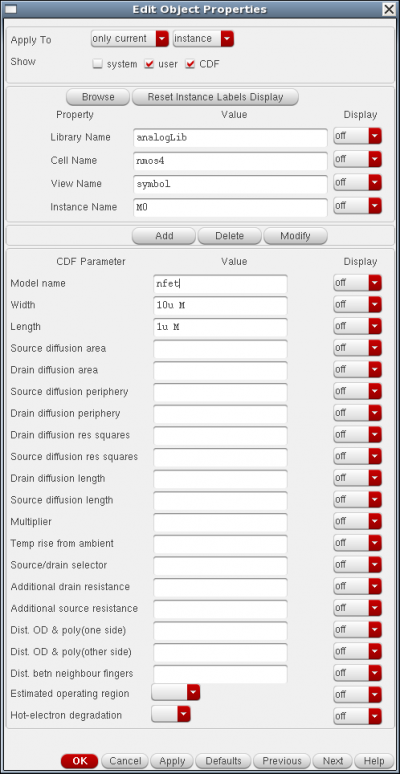
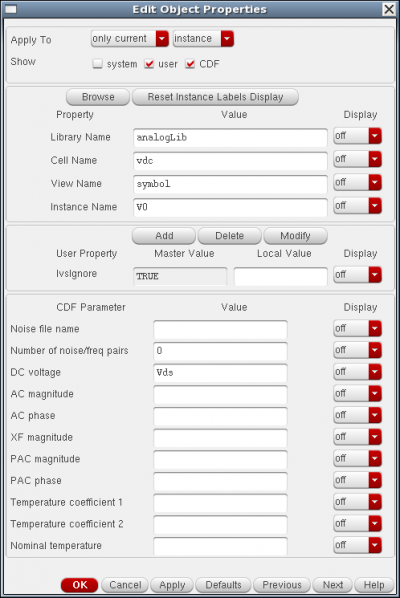
Select V0, edit instance properties with Schematic L ⇒ Edit ⇒ Properties or press q
set the value DC voltage to Vds
ADE L ⇒ Variables ⇒ Copy from Cellview
Repeat the same procedure for the V1 voltage source, setting Vgs
ADE L ⇒ Variables ⇒ Edit
Creare output variables and expressions:
ADE L ⇒ Outputs ⇒ Setup
Generate and check the Spectre netlist
Prima cosa controllare che la netlist sia generata correttamente!
ADE L ⇒ Simulation ⇒ Netlist ⇒ Create
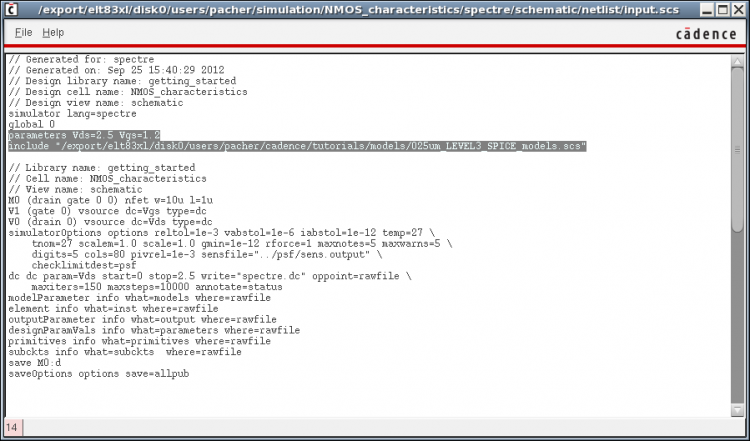
ADE L ⇒ Simulation ⇒ Netlist ⇒ View…
netlist che e' un file input.scs messo in
~/simulation/<cell_name>/spectre/schematic/netlist/input.scs
Look at the code! Non mangia!
// these are C-style comments
simulator lang=spectre
global 0
parameters Vds=2.5 Vgs=1.2
include "/path/to/model/files.scs"

...
...
Basic I/V characteristic
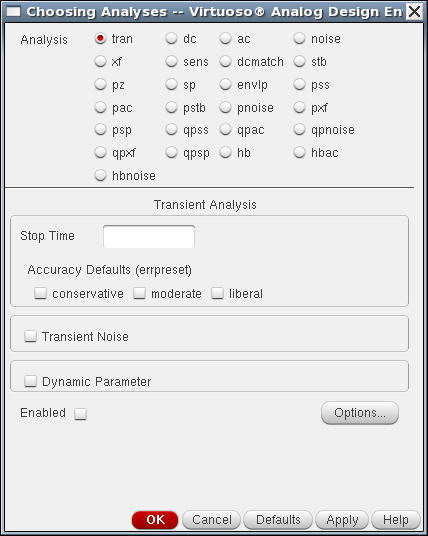
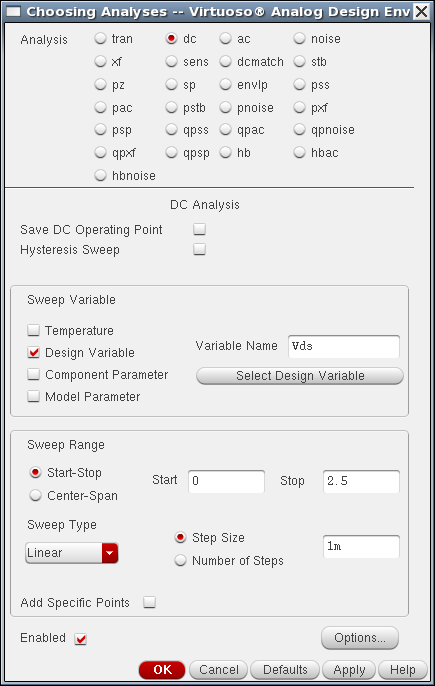
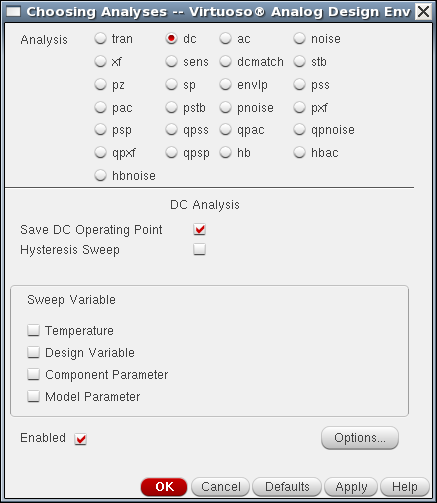
ADE L ⇒ Analyses ⇒ Choose
dc analysis
Sweep Variable ⇒ Design Variable ⇒ Variable Name Vds, Start 0 Stop 1.2
Oppure sceglire Component Parameter
IMPORTANTE! MOlte informazioni le posso ottenere anche dando
spectre -help <analysis>
spectre -help dc
ADE L ⇒ Outputs ⇒ To be Plotted ⇒ Select on Schematic
nodi = correnti, wire = voltages
ADE L ⇒ Simulation ⇒ Run
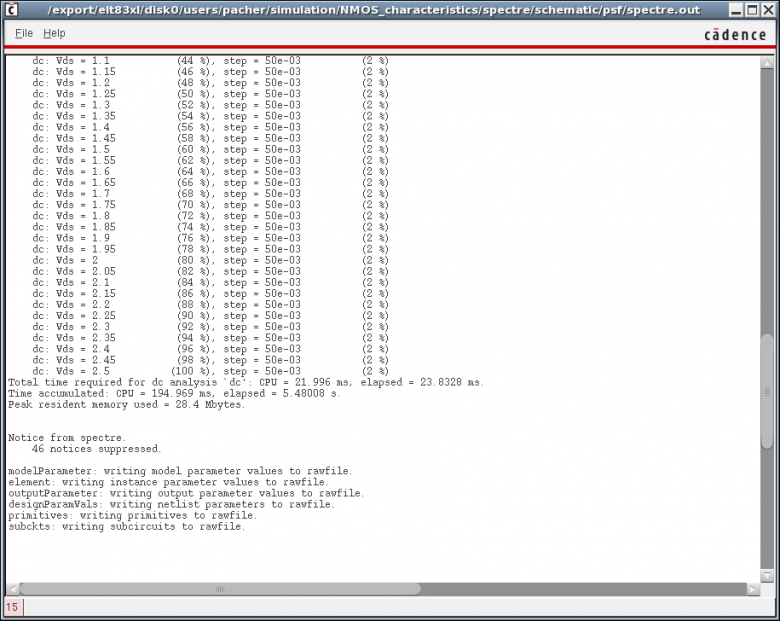
viene generato poi il file spectre.out che si trova in
~/simulation/<cell_name>/spectre/schematic/psf
E' accessibile anche come ADE L ⇒ Simulation ⇒ Outout Log…
La locazione del file spectre.out e' scritta sulla barra, cmq si trova in
~/simulation/<cell_name>/spectre/schematic/psf/spectre.out
psf e' di OCEAN, Parameter Storage Format (PSF)
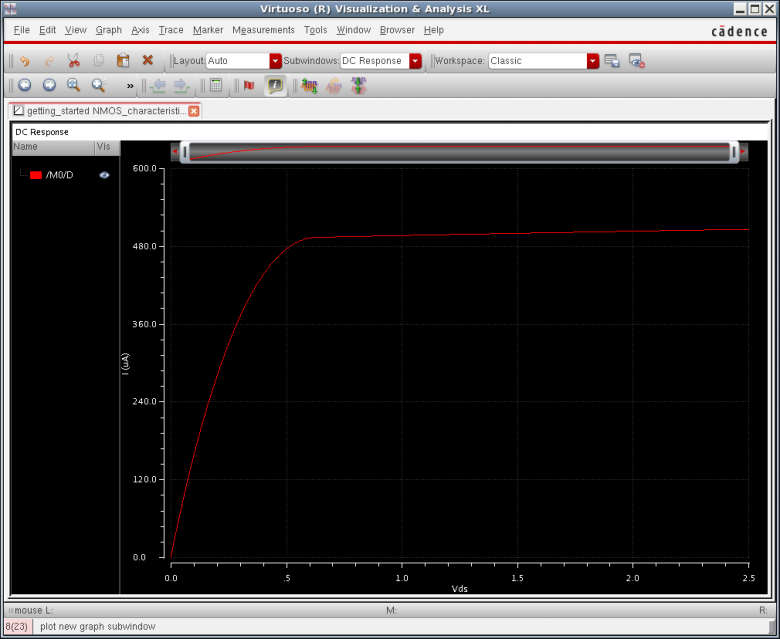
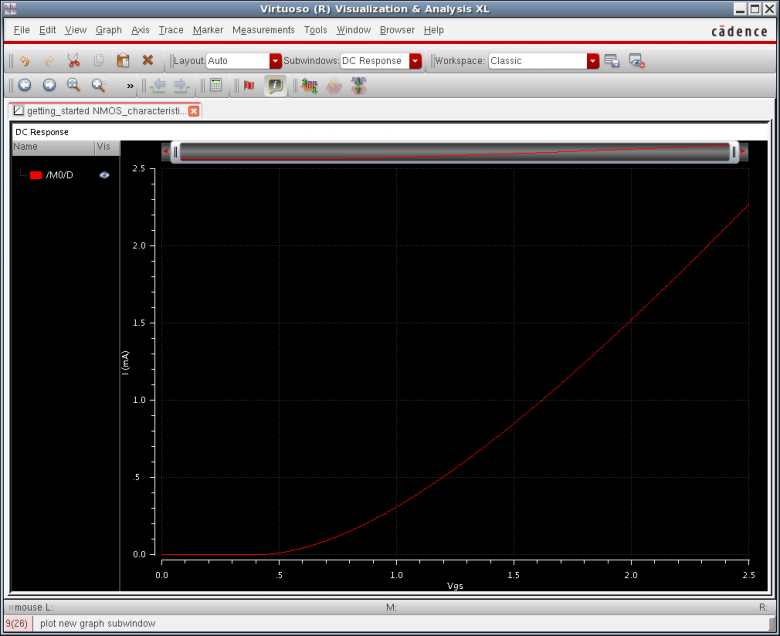
La caratteristica e' plottata in Virtuoso Visualization and Analysis (ViVa)
Mettere poi in SCALA logaritmica per vedere la subthreshold conduction!
Per accedere ai numerical data della waveform questi possono essere tabulati con
right click on the waveform, then select Table ⇒ New Window
Per export direttamente i dati in formato comma separated values (CSV) ci sono varie possibilita':
dalla table dei dati File ⇒ Save As CSV
oppure right click on the waveform and select Export… poi specificare il nome del file
Performing parametric analyses
The most powerful tools of ADE L !
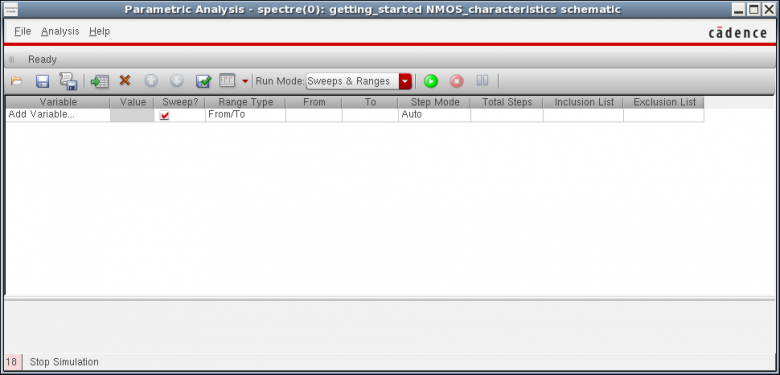
ADE L ⇒ Tools ⇒ Parametric Analysis
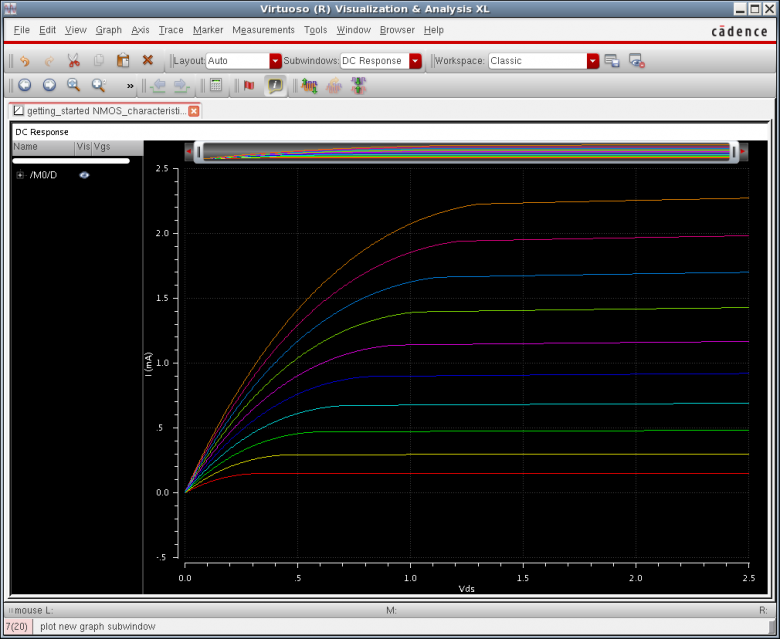
Vgs from 800 mV to 2.5 V, 10 total steps
poi Parametric Analysis ⇒ Analysis ⇒ Start Selected
da qui si puo' poi plottare anche gm = d Id/dVgs con deriv( ) del Calculator
Plot della gm:
click on the waveform ⇒ right click ⇒ Calculator
Saving and restoring the simulation states
ADE L ⇒ Session ⇒ Save State…
~/.artist_states/<cellName>
oppure in
~/cadence/tutorials/data
Specificare un nome significativo, del tipo
cellName_dd_mm_yyyy
Schamatic L ⇒ Launch ⇒ ADE L
ADE L ⇒ Session ⇒ Load State…
Transistor DC operating points (DC-OPs)
Save DC Operating Point
Dare un bell Check and Save
ADE L ⇒ Analyses ⇒ Choose
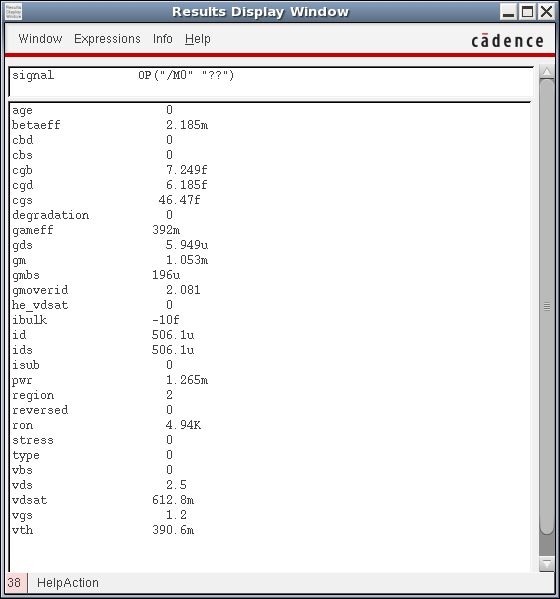
ADE L ⇒ Results ⇒ Print ⇒ DC operating points
Quali DOP vengono elencati dipende poi dal modello! I DC op. poiints piu' importanti sono:
| Parameter | Description |
|---|---|
betaeff | |
gds | |
gm | |
id | |
ids | |
region | |
ron | |
vds | |
vdsat | |
vgs | |
vth |
ADE L ⇒ Results ⇒ Annotate ⇒ DC Operating Points
Create output variables and expressions with the Calculator
Altra cosa fondamentale nella vita, creare variabili in output! e.g. gain, Cout etc…
Calculator ⇒ Tools ⇒ Plot
poi Move ⇒ New Window
poi click Open e nel Calculator click is che permette di selezionare
una forma d'onda di una corrente risultato di una DC/IC sweep (vs per selezionare una tensione invece)
poi cliccare deriv( )
generates the following expression
deriv(IS("/M0/D"))
/D per riferirsi al drain
Per richiamare una input variable in un'espressione in output usare la sintassi
VAR("variableName")
e.g. VAR(“Qin”)
Nota IMPORTANTISSIMA! Tutta questa sintassi e OCEAN syntax ! Il linguaggio di scripting della Cadence !
vedere anche here
Plotting DC operating points
Modo piu' semplice: fare una paramtric analysis e dal Calculator costruire le variabili di interesse click on op
Prima costruisco una variabile gm:
ADE L ⇒ Outputs ⇒ Setup
OP("/M0","gm")
Lo stesso risultato si ottiene con click Open poi nel Calculator click op, select the M0 instance on the schematic and then select gm in the parameters list
ADE L ⇒ Tools ⇒ Parametric Analysis …
Se faccio una singola simulazione vine solo evaluated un singolo DC-OP
gm, vth, etc…
Esce un worning sul numero di punti Too many Points? mettere OK
Notare come un LEVEL 3 fa schifo! Sii vede chiaramente una spike nel plot del
Modo alternativo (non funziona coi modelli che ho usato!) scrivere il file Spectre e includerlo saveOP.scs file
save M0:oppoints // saves ALL transistor parameters
save M0:vth // gm, betaeff, etc.
ADE L ⇒ Setup ⇒ Model Libraries… and include the saveOP.scs file
Other web tutorials can be found here and here
Plottare gm e intrinsic gain gm / gds
Costruire anche la current density gm / Id con una variabile
gmoverid
OP("/M0","gm")/OP("/M0","ids")
oppure usare direttamente il DOP gmoverid se la tecnologia lo fornisce!
OP("/M0","gmoverid")
Body-effect simulation
Interessante perche' introduce il problema del plottare una quantita' rispetto ad una data variabile!
e in cadence IC 6.1.5 devo usare l'opzione Y vs Y di ViVa, quindi devo
- plottare Id vs Vd sweeppando Vd
- costruire la variabile vds = vd - vs dai DC op.
OP("M0","vds")
oppure come
VDC("/M0/D") - VDC("/M0/S")
e plottare vds vs vd
- usare Y vs Y e plottare finalmente Id vs Vds
MOS capacitances
Oppure si possono studiare i valori della capacitances
- cgg
- cdd
- css
OP("/M0","cgg")
Measure the transistor transition frequency
In order to simulate the transition frequency of the NMOS transistor modify the schematic as follows. Put a high resistance ~10M ohm at the gate, adding an idc current source in parallel. Edit the current source properties with a DC value of 100n A (which determines the DC bias voltage) and set the AC Magnitude to 1.
Cosi' si introduce anche la AC analysis
fT = 1/2pi gm / CGS
Si possono gia' fare i plot della magnitude e della phase e in Bode diagram con il calculator !
Per esercizio far calcolare il phase margin (PM)
in the waveform viewer u could use the calculator or set the cursor to the point where the gain becomes )db the corresponding phase subtracted from 180 gives u the PM Look stability analysis in Spectre help.
ADE L ⇒ Results ⇒ Direct Plot ⇒ AC magnitude and Phase
oppure selezionare il drain net
20*log10(IC("/M0/D"))
db20(IC("/M0/D")
bandwidth( ...)
phase()
or
phaseDeg()

